
This is your go-to resource for navigating and understanding the Analytics dashboard. Use the clickable index below to jump to each section.
Last updated: June 2025
Fabulate Analytics 2.0 is a powerful reporting tool designed to help you understand how your campaigns, creators, and content are performing. This guide will walk you through each section of the dashboard with simple explanations, tips, and visuals.
Posts are automatically pulled in using keyword matching to identify talent-generated posts linked to your campaign.
Note: Posts from unauthenticated creators only show up if they’re manually added to a deliverable or task.
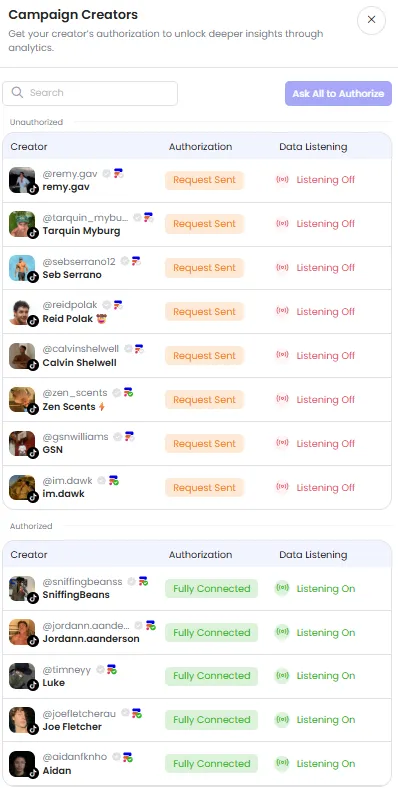
This is your go-to hub for validating and managing creator-generated content. It ensures that:

Sorting filters in the Pulse tab organise posts by date, engagement, platform, and more, simplifying performance analysis across platforms. Here’s an overview of the Sorting Filters and their definitions.
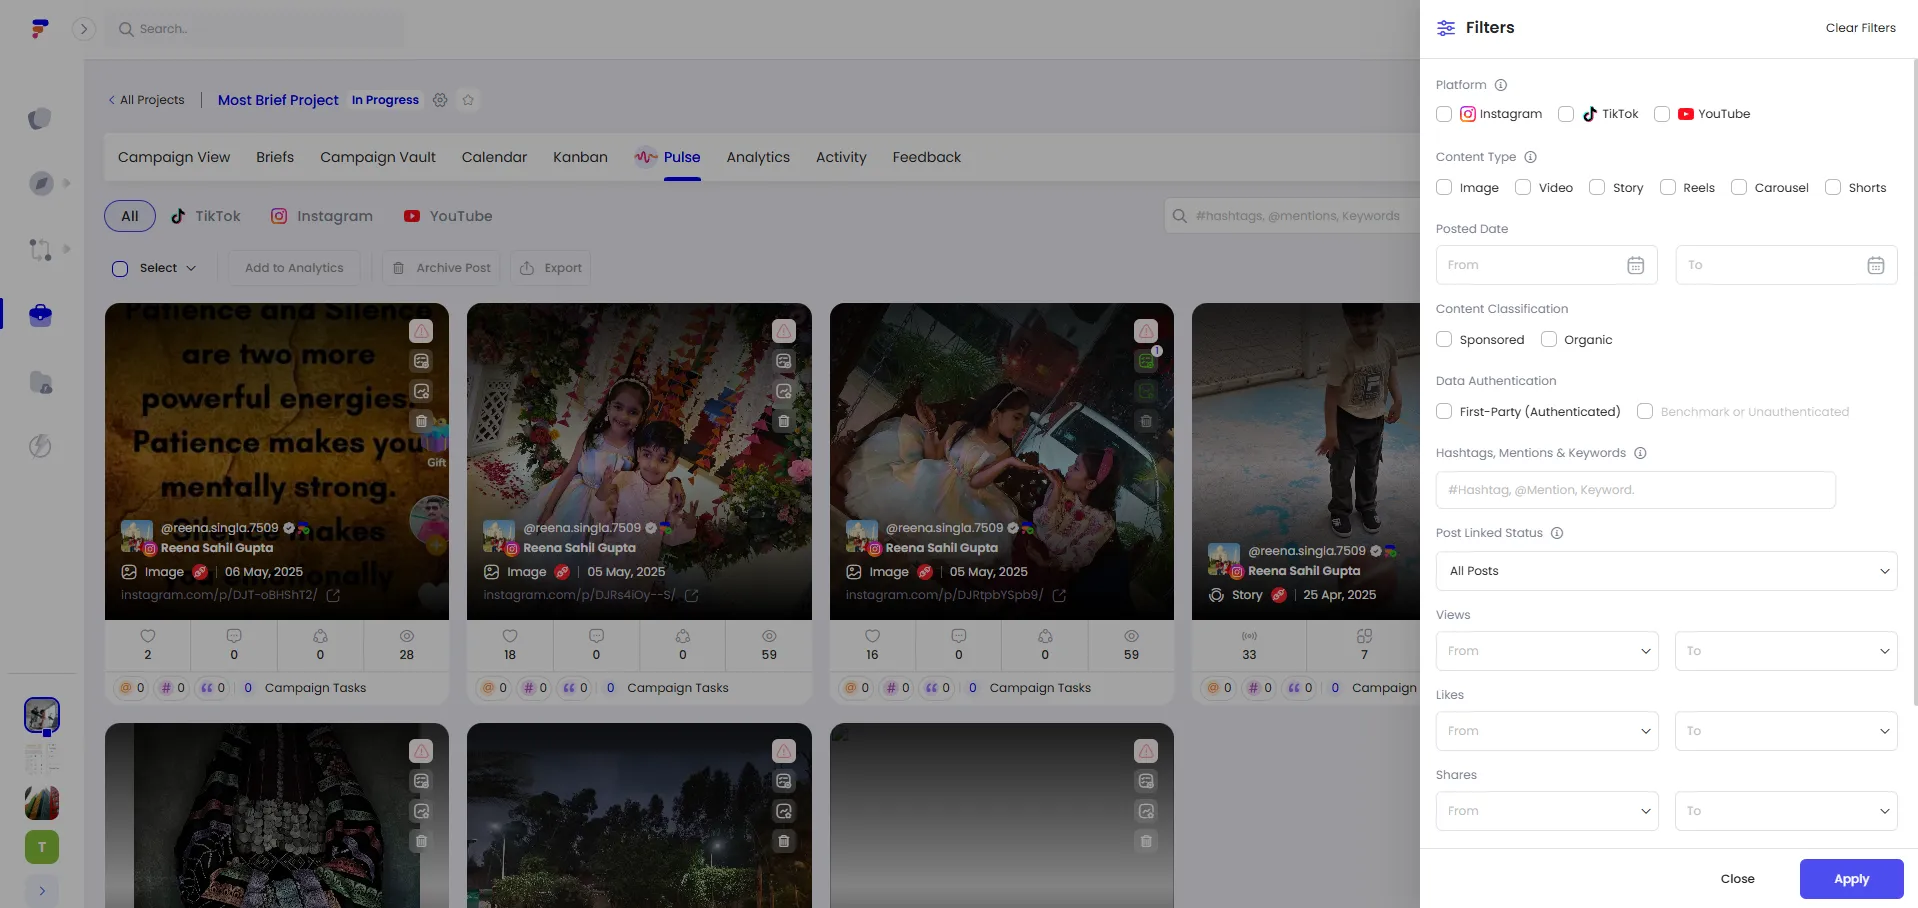
⚠️ When you sort by “Interactions”, Stories appear first, sorted by interaction count. However, non-Stories will still be shown unless you apply the “Content Type: Story” filter to narrow your view.
In this section, we’ll outline the post metrics found in the Pulse tab and explain each one in detail.
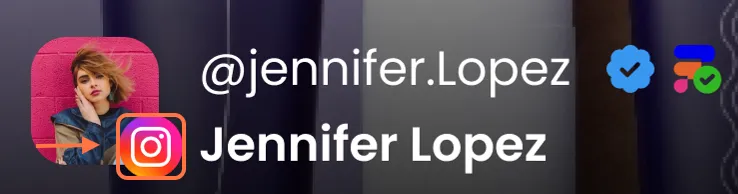
Each post card in the Pulse Tab provides key performance indicators (KPIs) to track influencer content performance. These metrics provide a quick overview of the post's impact, helping users analyze engagement levels across different influencer post. Let’s explore the Post Metrics section, including its definitions and purpose.


This makes it easy to track creative compliance at a glance
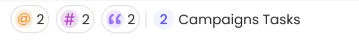
In this section, we’ll break down the components of post actions in the Pulse tab and provide clear definitions for each.
Each Post in the tab comes with three action icons. Here's what they do:


Below are the key elements of the Overview Tab and how they help you understand your campaign better.
This section surfaces essential campaign stats that give you a topline view of overall performance. Let’s take a closer look at the Campaign Overview section to learn more.
Note: These metrics act as a real-time summary of campaign efficiency and scale.
This section breaks down user interactions with campaign content. Let’s delve into the Engagement Overview section to learn more.
This section helps you visualize campaign activity and trends. Let’s take a closer look at the Charts & Visual Insights section to learn more.
Notes: Use the platform filter in charts to toggle between Instagram, TikTok, and YouTube. Hovering over graphs shows exact daily values. Sorting options help you build tailored reports based on campaign priorities.
Let’s dive into the Top Creators and Top Posts section.
The Content Tab provides a detailed view of content-level performance, allowing you to identify top-performing formats and creative styles. By analysing content metrics, you can refine your strategy to maximise engagement and efficiency. Below are the key components of the Content Tab:
Here are the dropdown options available in the Content tab and what each one does.
This section highlights important metrics that help identify what resonates most with your audience. See below for more details.
The visual layout is designed to make browsing and comparison easy. It includes these features:
The Creators Tab helps you recognise the talent driving your campaign’s success! By tracking performance, you can see which creators made the biggest impact and how their content resonated with audiences. With these insights, you can strengthen partnerships and refine future collaborations.
Use this tab to:
Here’s the dropdown available in the Content tab and its functions.
Benchmark Settings in Fabulate Analytics are fallback values used when full performance data (such as reach, saves, or views) is missing — typically due to:
These benchmarks ensure that campaign reports remain complete and consistent even when certain data points are unavailable.
Benchmark Settings help maintain reporting accuracy and transparency by allowing you to:
Below is the function of Benchmark Settings and how it helps enhance your analysis.
Note: Project-level settings are used only within that project. They do not override workspace or platform-level defaults.
The Benchmark Settings interface is split into two sections:
All Post Types (excluding Stories)
For each creator tier:
You can input fallback percentages for:
Instagram Stories
For each tier above, you can input values for:
When a post or creator’s performance data is missing, your set benchmark values are used instead. This keeps your campaign performance calculations complete and consistent.
Benchmarks are visible alongside actual results across the Overview, Content, and Creators tabs — clearly indicating when fallback data is in use.
Note: Project-level settings are used only within that project. They do not override workspace or platform-level defaults.
To help users understand where performance data is coming from, Fabulate uses a color-coded system to indicate data source reliability and type. You can find them in the table below.
At the bottom of the settings panel, you can choose how to calculate by:
All tabs include an Export button for downloading data in Excel format for offline reporting or presentations.
Common questions and fixes.
If you have any other questions or concerns, feel free to reach out to us via email at support@fabulate.com.au or contact your Customer Success Manager.